Once you have created a link or usage, you can create an Impact Analysis Diagram displaying a graphical representation of those links. You can update an existing Impact Analysis diagram rather than generating a new one for the same element. The Impact Analysis Diagram can also be viewed as a grid.
If a source object has been linked to an External Data Object Attribute, Column, or Data Element, they also will appear on the Impact Analysis Diagram. Their names are displayed as ParentName.Name in the view and are not editable in the diagram. You can double-click on them to open the associated Property View, where you can change their properties.
You can create an Impact Analysis Diagram several ways:
Right-click an element that you have created a link or usage for in the Model View tree and select Impact Analysis > Generate New Diagram....
or
Right-click an element that you have created a link or usage for in the Diagram View and select Impact Analysis Diagram....
or
Open the Property View for an element and click ![]() in on the Impact Analysis tab.
in on the Impact Analysis tab.
or
Select an element in the Model View tree or Diagram View and on the main menu select Tools > Generate Impact Analysis Diagram....
Note: You will get a warning dialog telling you that they may be a delay when generating large diagrams.
The created diagram appears as an additional tab in the Diagram View. It also appears in the Model View tree and is represented by the following icon: ![]() . You can save the diagram by clicking
. You can save the diagram by clicking ![]() . You can also print this diagram by clicking
. You can also print this diagram by clicking ![]() on the Standard toolbar.
on the Standard toolbar.
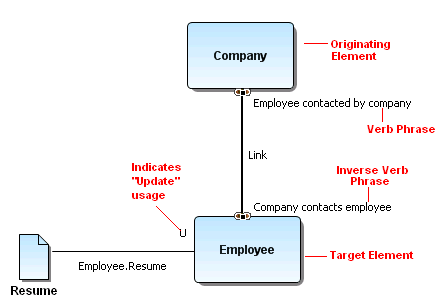
The following example shows a sample Impact Analysis Diagram. The two tasks (Company and Employee) are linked and have both a verb phrase and an inverse verb phrase. The data object (Resume) shows a usage indicator connected to the Employee task and has a usage setting of “C” for create.