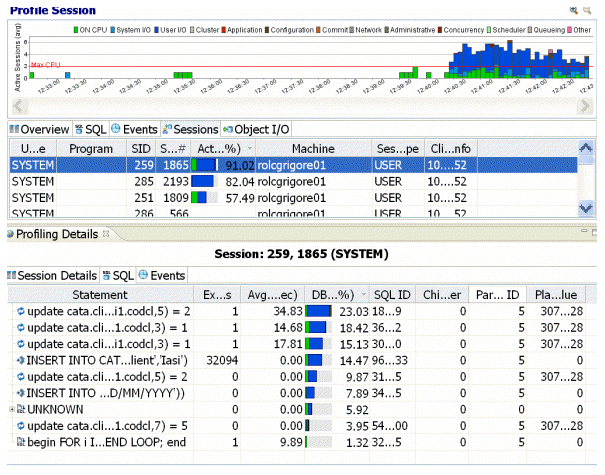
When you select any item from Top Activity, details are displayed on the Profiling Details view.
Tip: You may have to select Windows > Show View > Profiling Details to display the Profiling Details view.
The tabs that compose the Profiling Details view are dependent on the nature of the object selected in Top Activity, in order to reflect that item’s specific information. The tabs are also dependent on the data source platform. For example, the Object I/O tab is available only for the Oracle platform whereas the Procedures tab is available only for the SQL Server and Sybase platforms.

Profiling Details displays detailed parameter information on a statement, event, or session that was selected in Top Activity. The data displayed also varies by database platform.
Depending on the data source platform you have specified, the tabs that appear in the view will be different, in order to accommodate the parameter specifics of the statement you have selected.
Depending on the top activity selected and the profiled platform types, some tabs may not be available.
Note: When right-clicking on a SQL statement in the Top Activity section in the SQL Profiler, if the SQL statement is run by a different user than the user who is running DB Optimizer, than the User Mismatch dialog appears, with an example of the following message: This query was executed by [SOE] and you are currently connected as [system]. We recommend you reconnect as [SOE] to tune the SQL. Would you like to continue anyway? This message indicates that the statement is being tuned by a user other than the user who originally ran the query, and tables may be missing based on the different schemas. Click OK to run the query, or click Cancel and run the tuning job under the original user.