|
Name |
Description |
|
| |
|
| |
|
| |
|
By default, each series has the same graph type, defined by the template for its dimension. To change all series to the same graph type, you can change the template type. See Changing other decision graph series properties. for instructions. | |
|
If you use an ordinary TQuery component as a decision dataset, you must manually set up the SQL statement, taking care to supply a GROUP BY phrase which contains the same fields (and in the same order) as the SELECT phrase. The SQL should look similar to this: | |
|
| |
|
The DimensionMap properties of TDecisionCube not only control which dimensions and summaries appear but also let you set date ranges and specify the maximum number of dimensions the decision cube may support. You can also indicate whether or not to display data during design. You can display names, (categories) values, subtotals, or data. Display of data at design time can be time consuming, depending on the data source. When you click the ellipsis next to DimensionMap in the Object Inspector, the Decision Cube editor dialog box appears. You can use its pages and controls to set the DimensionMap properties.... more | |
|
Users can drag from side to side or up and down in the graph grid area to scroll through off-screen categories and values. | |
|
Users can: Right-click within the decision grid and choose to:
Drag and drop dimensions from rows to columns and the reverse. | |
|
Users can: Left-click the summary button at the left end of the decision pivot to display a list of available summaries. They can use this list to change the summary data displayed in decision grids and decision graphs. Right-click a dimension button and choose to:
| |
|
At runtime, users can perform many operations by left-clicking, right-clicking, and dragging visible decision support components. These operations are summarized below.
| |
|
You can drill down to see more detail in a dimension. For example, if you right-click a category label (row heading) for a dimension with others collapsed beneath it, you can choose to drill down and only see data for that category. When a dimension is drilled, you do not see the category labels for that dimension displayed on the grid, since only the records for a single category value are being displayed. If you have a decision pivot on the form, it displays category values and lets you change to other values if you want. To drill down into... more | |
|
You can change the ControlType property of the decision source to determine whether more than one dimension can be selected for each axis of the grid. For more information, see Using Decision Sources. | |
|
If a plus sign (+) appears in a dimension or summary field, one or more fields to its right are closed (hidden). You can open additional fields and categories by clicking the sign. A minus sign (–) indicates a fully opened (expanded) field. When you click the sign, the field closes. This outlining feature can be disabled; see Decision Grid Properties for details. | |
|
The decision support components appear on the Decision Cube category of the Tool Palette:
| |
|
The following are some special properties that control the appearance and behavior of decision pivots:
| |
|
You can drag row and column headings to new locations within the same axis or to the other axis. In this way, you can reorganize the grid and see the data from new perspectives as the data groupings change. This pivoting feature can be disabled; see Decision Grid Properties for details. If you included a decision pivot, you can push and drag its buttons to reorganize the display. See Using decision Pivots for instructions. | |
|
By default, only settings for templates are saved at design time. Changes made to specific series are only saved if the Save box is checked for that series in the Chart Editing dialog box. Saving series can be memory intensive, so if you don't need to save them you can uncheck the Save box. | |
|
Decision graphs display the values from two dimensions of the decision cube: one dimension is displayed as an axis of the graph, and the other is used to create a set of series. The template for that dimension provides default properties for those series (such as whether the series are bar, line, area, and so on). As users pivot from one state to another, any required series for the dimension are created using the series type and other defaults specified in the template. A separate template is provided for cases where users pivot to a state where only one dimension... more | |
|
The ActiveFlag property controls which dimensions get loaded. You can set this property on the Dimension Settings tab of the Decision Cube editor using the Activity Type control. When this control is set to Active, the dimension is loaded unconditionally, and will always take up space. Note that the number of dimensions in this state must always be less than MaxDimensions, and the number of summaries set to Active must be less than MaxSummaries. You should set a dimension or summary to Active only when it is critical that it be available at all times. An Active... more | |
|
The decision cube's MaxDimensions and MaxSummaries properties can be used with the CubeDim.ActiveFlag property to control how many dimensions and summaries can be loaded at a time. You can set the maximum values on the Cube Capacity page of the Decision Cube editor to place some overall control on how many dimensions or summaries can be brought into memory at the same time. Limiting the number of dimensions or summaries provides a rough limit on the amount of memory used by the decision cube. However, it does not distinguish between dimensions with many values and those with only a few.... more | |
|
To determine the maximum number of dimensions and summaries available for decision pivots, decision grids, and decision graphs bound to the selected decision cube, display the Decision Cube editor and click the Memory Control tab. Use the edit controls to adjust the current settings, if necessary. These settings help to control the amount of memory required by the decision cube. For more information, see Decision Support Components and Memory Control. | |
|
When Binning is set to Set on the Dimension Settings tab of the Decision cube editor and Start Value is not NULL, the dimension is said to be "paged," or "permanently drilled down." You can access data for just a single value of that dimension at a time, although you can programmatically access a series of values sequentially. Such a dimension may not be pivoted or opened. It is extremely memory intensive to include dimensional data for dimensions that have very large numbers of values. By making such dimensions paged, you can display summary information for one value at a... more | |
|
To determine how much information appears at design time, display the Decision Cube editor and click the Memory Control tab. Then, check the setting that indicates which names and data to display. Display of data or field names at design time can cause performance delays in some cases because of the time needed to fetch the data. | |
|
To view the dimension settings, display the Decision Cube editor and click the Dimension Settings tab. Then, select a dimension or summary in the Available Fields list. Its information appears in the boxes on the right side of the editor:
| |
|
| |
|
One-dimensional crosstabs show a summary row (or column) for the categories of a single dimension. For example, if Payment is the chosen column dimension and Amount Paid is the summary category, the crosstab in the following figure shows the amount paid using each method.  | |
|
The decision graph component, TDecisionGraph, displays fields from the decision source TDecisionSource as a dynamic graph that changes when data dimensions are opened, closed, dragged and dropped, or rearranged with the decision pivot TDecisionPivot. Graphed data comes from a specially formatted dataset such as TDecisionQuery. For an overview of how the decision support components handle and arrange this data, see Using Decision Support Components. By default, the first row dimension appears as the x-axis and the first column dimension appears as the y-axis. You can use decision graphs instead of or in addition to decision grids, which present cross-tabulated data... more | |
|
By default, the decision graph plots summary values for categories in the first active row field (along the y-axis) against values in the first active column field (along the x-axis). Each graphed category appears as a separate series. If only one dimension is selected—for example, by clicking only one TDecisionPivot button—only one series is graphed. If you used a decision pivot, you can push its buttons to determine which decision cube fields (dimensions) are graphed. To exchange graph axes, drag the decision pivot dimension buttons from one side of the separator space to the other. If you have a one-dimensional... more | |
|
You can use the Decision Cube editor to set the DimensionMap properties of decision cubes. You can display the Decision Cube editor through the Object Inspector, as described in the previous section, or by right-clicking a decision cube on a form at design time and choosing Decision Cube editor. The Decision Cube Editor dialog box has two tabs:
| |
|
Decision graph components, TDecisionGraph, present cross-tabulated data in graphic form. Each decision graph shows the value of a single summary, such as Sum, Count, or Avg, charted for one or more dimensions. For more information on crosstabs, see One-dimensional crosstabs. For illustrations of decision graphs at design time, see the figures Decision support components at design time and Decision graphs bound to different decision sources. The following topics are discussed in this section: | |
|
Multidimensional crosstabs use additional dimensions for the rows and/or columns. For example, a two-dimensional crosstab could show amounts paid by payment method for each country. A three-dimensional crosstab could show amounts paid by payment method and terms by country, as shown in the following figure. 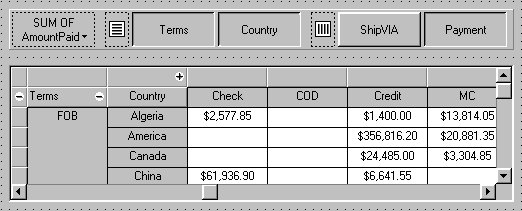 | |
|
The decision cube component, TDecisionCube, is a multidimensional data store that fetches its data from a dataset (typically a specially structured SQL statement entered through TDecisionQuery or TQuery). The data is stored in a form that makes its easy to pivot (that is, change the way in which the data is organized and summarized) without needing to run the query a second time. The following topics are discussed in this section: | |
|
The decision grid component, TDecisionGrid, displays data from the TDecisionSource component bound to TDecisionSource. By default, data appears in a grid with category fields on the left side and top of the grid. The following are some special properties that control the appearance and behavior of decision grids:
| |
|
The decision pivot component, TDecisionPivot, lets you open or close decision cube dimensions, or fields, by pressing buttons. When a row or column is opened by pressing a TDecisionPivot button, the corresponding dimension appears on the TDecisionGrid or TDecisionGraph component. When a dimension is closed, its detailed data doesn't appear; it collapses into the totals of other dimensions. A dimension may also be in a "drilled" state, where only the summaries for a particular value of the dimension field appear. You can also use the decision pivot to reorganize dimensions displayed in the decision grid and decision graph. Just drag... more | |
|
The templates supply many defaults for each decision cube dimension, such as graph type and how series are displayed. Other defaults, such as series color, are defined by TDecisionGraph. If you want you can override the defaults for each series. The templates are intended for use when you want the program to create the series for categories as they are needed, and discard them when they are no longer needed. If you want, you can set up custom series for specific category values. To do this, pivot the graph so its current display has a series for the category... more | |
|
The only decision support component that binds directly to a dataset is the decision cube, TDecisionCube. TDecisionCube expects to receive data with groups and summaries defined by an SQL statement of an acceptable format. The GROUP BY phrase must contain the same non-summarized fields (and in the same order) as the SELECT phrase, and summary fields must be identified. The decision query component, TDecisionQuery, is a specialized form of TQuery. You can use TDecisionQuery to more simply define the setup of dimensions (rows and columns) and summary values used to supply data to decision cubes (TDecisionCube). The... more | |
|
The decision support components help you create cross-tabulated—or, crosstab—tables and graphs. You can then use these tables and graphs to view and summarize data from different perspectives. For more information on cross-tabulated data, see About crosstabs. The following topics are discussed in this section: | |
|
When a dimension or summary is loaded into the decision cube, it takes up memory. Adding a new summary increases memory consumption linearly: that is, a decision cube with two summaries uses twice as much memory as the same cube with only one summary, a decision cube with three summaries uses three times as much memory as the same cube with one summary, and so on. Memory consumption for dimensions increases more quickly. Adding a dimension with 10 values increases memory consumption by a factor of 10. Adding a dimension with 100 values increases memory consumption 100 times. Thus adding... more | |
|
The decision grid component, TDecisionGrid, displays data from decision cubes TDecisionCube bound to decision sources TDecisionSource. By default, the grid appears with dimension fields at its left side and/or top, depending on the grouping instructions defined in the dataset. Categories, one for each data value, appear under each field. You can
| |
|
The decision graph component, TDecisionGraph, displays fields from the decision source (TDecisionSource) as a dynamic graph that changes when data dimensions are opened, closed, dragged and dropped, or rearranged with the decision pivot TDecisionPivot. You can change the type, colors, marker types for line graphs, and many other properties of decision graphs. | |
|
| |
|
All data used by the decision support components passes through the decision cube, which accepts a specially formatted dataset most easily produced by an SQL query. See Using datasets with decision support components for more information. While both TTable and TQuery can be used as decision datasets, it is easier to use TDecisionQuery; the Decision Query editor supplied with it can be used to specify tables, fields, and summaries to appear in the decision cube and will help you set up the SELECT and GROUP BY portions of the SQL correctly. | |
|
The decision source component, TDecisionSource, defines the current pivot state of decision grids or decision graphs. Any two objects which use the same decision source also share pivot states. The following are some special properties and events that control the appearance and behavior of decision sources:
| |
|
Decision grid components, TDecisionGrid, present cross-tabulated data in table form. These tables are also called crosstabs, described in About crosstabs. The figure Decision support components at design time shows a decision grid on a form at design time. The following topics are discussed in this section: | |
|
Cross-tabulations, or crosstabs, are a way of presenting subsets of data so that relationships and trends are more visible. Table fields become the dimensions of the crosstab while field values define categories and summaries within a dimension. You can use the decision support components to set up crosstabs in forms. TDecisionGrid shows data in a table, while TDecisionGraph charts it graphically. TDecisionPivot has buttons that make it easier to display and hide dimensions and move them between columns and rows. Crosstabs can be one-dimensional or multidimensional. The following topics are discussed in this section: | |
|
The decision support components listed in Overview of decision support components can be used together to present multidimensional data as tables and graphs. More than one grid or graph can be attached to each dataset. More than one instance of TDecisionPivot can be used to display the data from different perspectives at runtime. |
|
Copyright(C) 2009 Embarcadero Technologies, Inc. All Rights Reserved.
|
|
What do you think about this topic? Send feedback!
|


 Topics